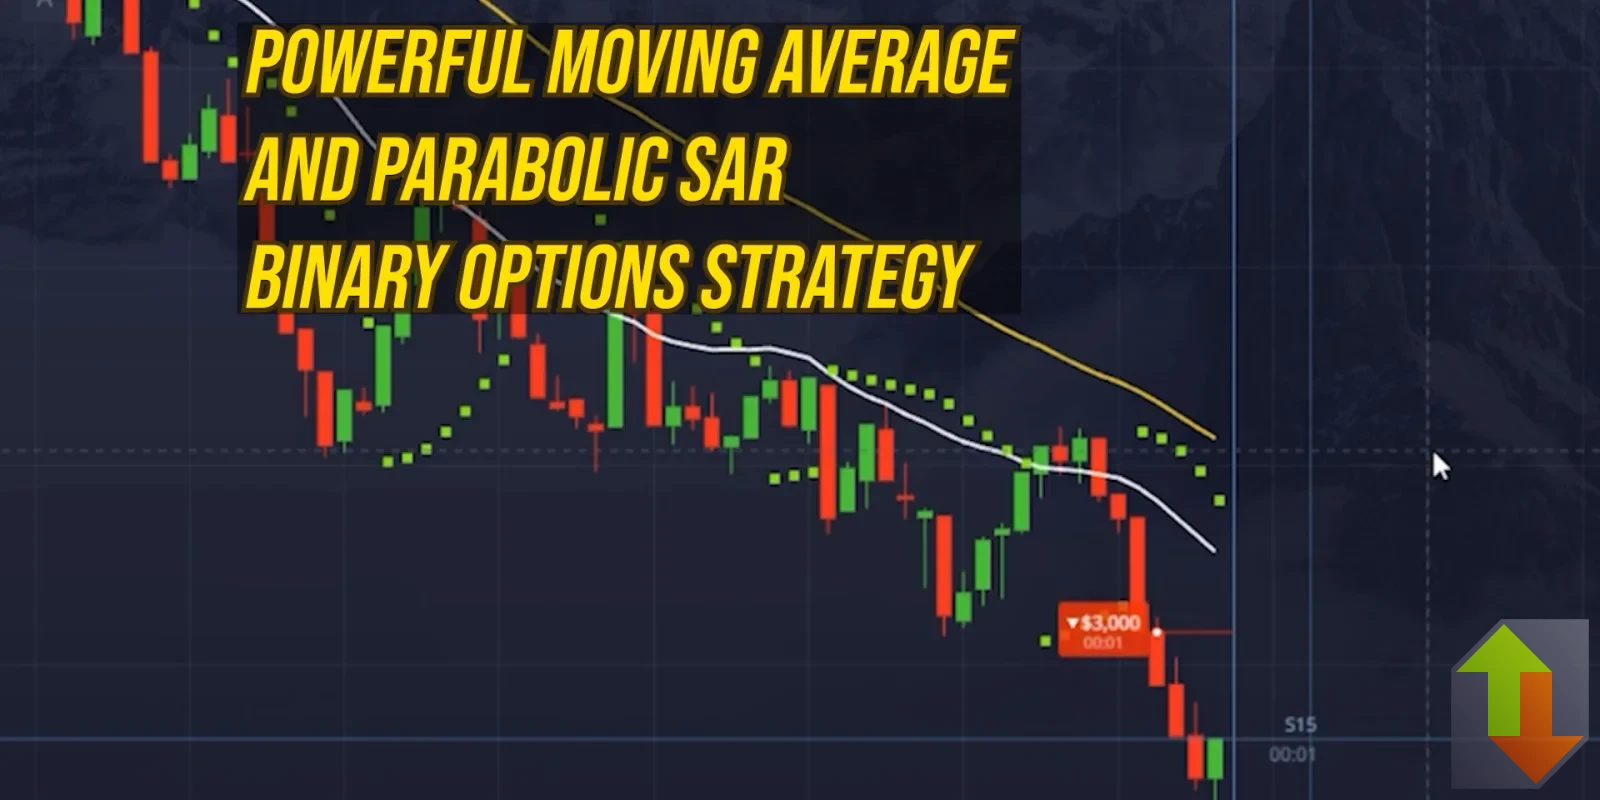
Powerful Moving Average and Parabolic SAR Binary Options Strategy with 3 Clear Examples
Binary options traders often search for strategies that balance simplicity with effectiveness. One proven method is the moving average and parabolic SAR binary options strategy, which combines two classic indicators to capture trends and pinpoint entries. In this article, you’ll learn how to set up the strategy, see multiple examples, and discover how to practice it safely before going live.
If you are looking for a broker, read our guide on PocketOption and try the moving average and parabolic SAR binary options strategy first on a free demo account.
⚠️ Risk Disclaimer
Binary options are a high-risk financial instrument. Trading may not be suitable for all investors, and you should never risk money you cannot afford to lose. The strategies and examples shown in this article and video are for educational purposes only and should not be considered financial advice.
Make sure to read our full Risk Disclaimer.
📺 Watch the Strategy in Action
I know some traders prefer a visual explanation with audio narration rather than just reading text. If you are one of them, you’ll find the full step-by-step breakdown in the video above. Watching the live trade examples makes it easier to see how the strategy plays out in real market conditions, and you can pause or replay key moments anytime.
What Are Moving Averages?
Moving averages (MAs) are among the most popular indicators in trading. They smooth out price fluctuations and help traders see the underlying trend.
- Simple Moving Average (SMA): Calculates the average price over a set number of candles.
- Exponential Moving Average (EMA): Gives more weight to recent price data, reacting faster to changes.
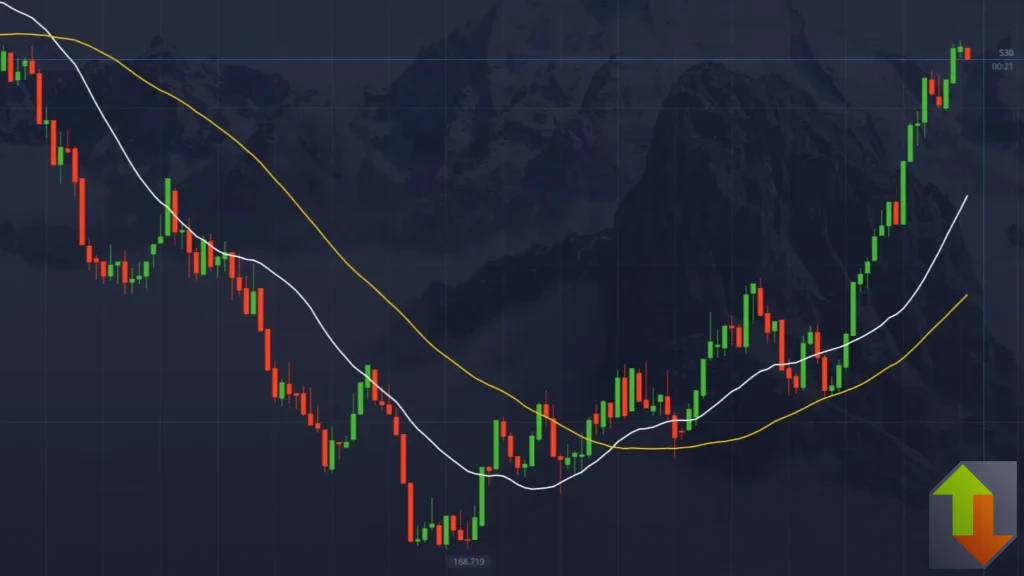
In the moving average and parabolic SAR binary options strategy, we use two moving averages: one shorter (21-period) and one longer (50-period). Their relationship helps us identify bullish or bearish momentum.
What Is the Parabolic SAR?
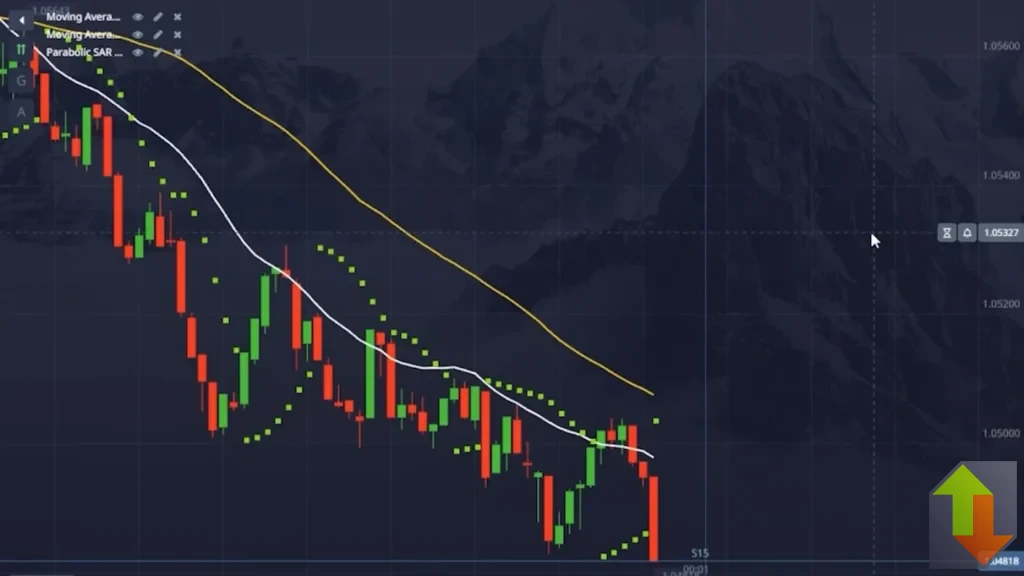
The parabolic SAR (Stop and Reverse) is a momentum indicator created by J. Welles Wilder. It places dots above or below candles:
- Dots below candles → Bullish bias
- Dots above candles → Bearish bias
The SAR is excellent for timing entries but is prone to false signals in sideways markets. That’s why combining it with moving averages makes the method much stronger.
Why Combine Moving Averages with Parabolic SAR?
Each indicator has strengths and weaknesses:
- Moving Averages → Identify the bigger trend, but react slowly.
- Parabolic SAR → Quick to flip signals, but can give false triggers in ranges.
By combining them, the moving average and parabolic SAR binary options strategy filters out weak setups. You only take SAR signals when they align with the trend confirmed by the moving averages.
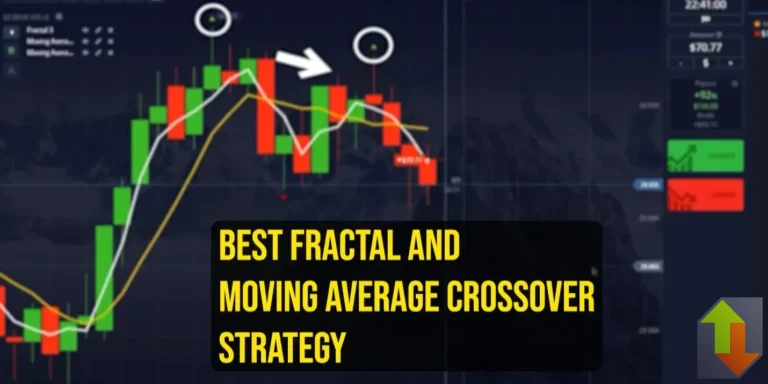
If you like combining moving averages with other confirmation tools, try the Fractal and Moving Average Crossover strategy, which I used in a $10 challenge.
How to Set Up the Strategy
To configure the moving average and parabolic SAR binary options strategy, follow these steps:
- Chart timeframe: 15 seconds
- Trade duration: 1 minute (use free expiration mode)
- Indicators:
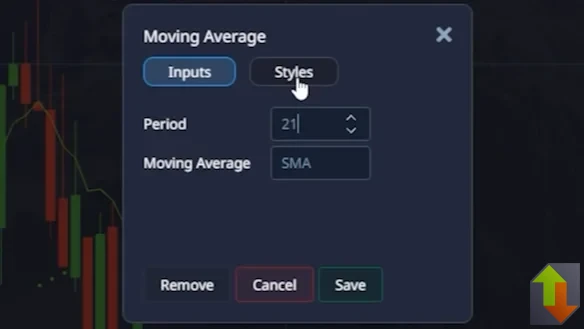
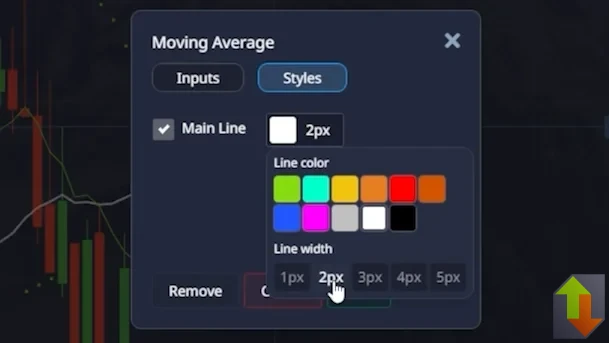
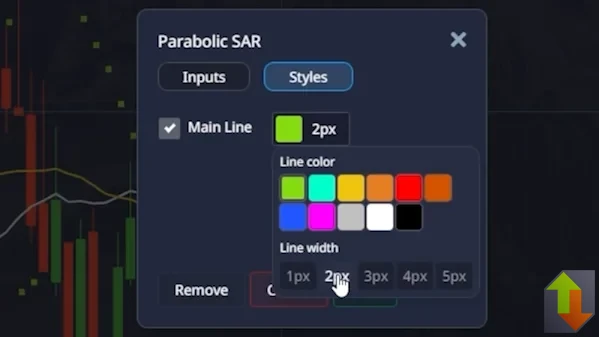
- Moving Average (period 21, styled for visibility)
- Moving Average (period 50, different color)
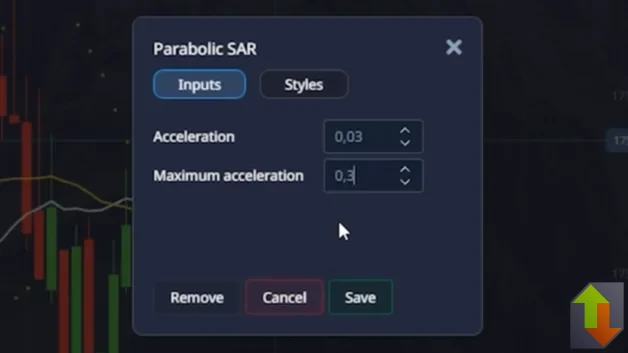
- Parabolic SAR (acceleration = 0.03, maximum = 0.3)
👉 If having trouble to set up your chart properly, check the detailed steps in the YouTube video.
Entry Rules
The Moving Average and Parabolic SAR Binary Options Strategy has the following simple entry rules:
- Identify the trend with moving averages:
- 21 MA above 50 MA → Uptrend
- 21 MA below 50 MA → Downtrend
- Wait for parabolic SAR flip:
- Dots below candles in uptrend → Call option (Buy)
- Dots above candles in downtrend → Put option (Sell)
- Confirm the setup: Look for clear trends, avoid choppy sideways action.
- Enter trade: Trade duration = 1 minute.
Live Trading Examples
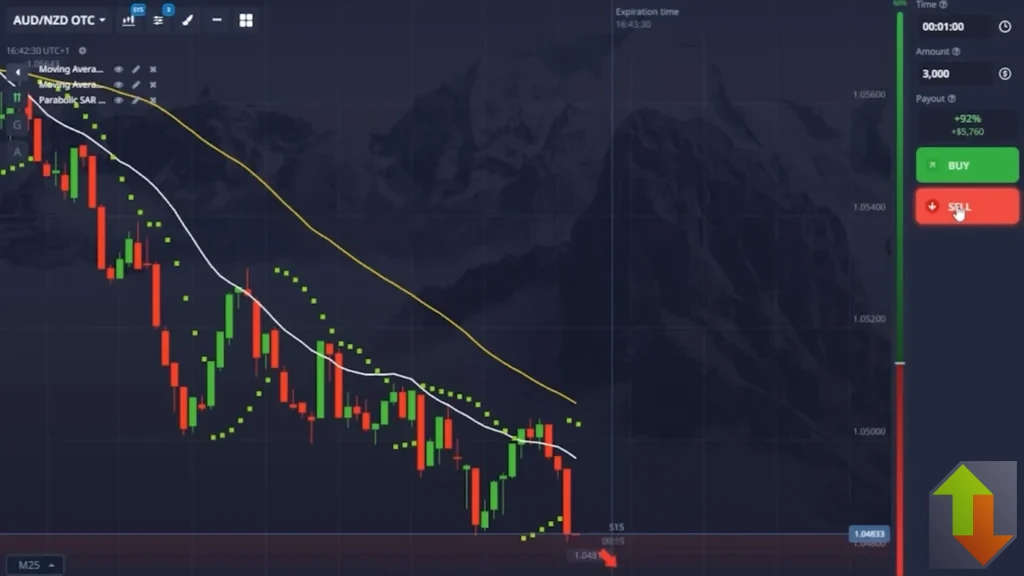
Example 1: Bearish Setup
A strong bearish candle closed below the Keltner channel and the parabolic SAR flipped above the candles. The 21 MA was clearly under the 50 MA. (See the trade in action.)
I entered a put (SELL) option, and the trade closed in profit.
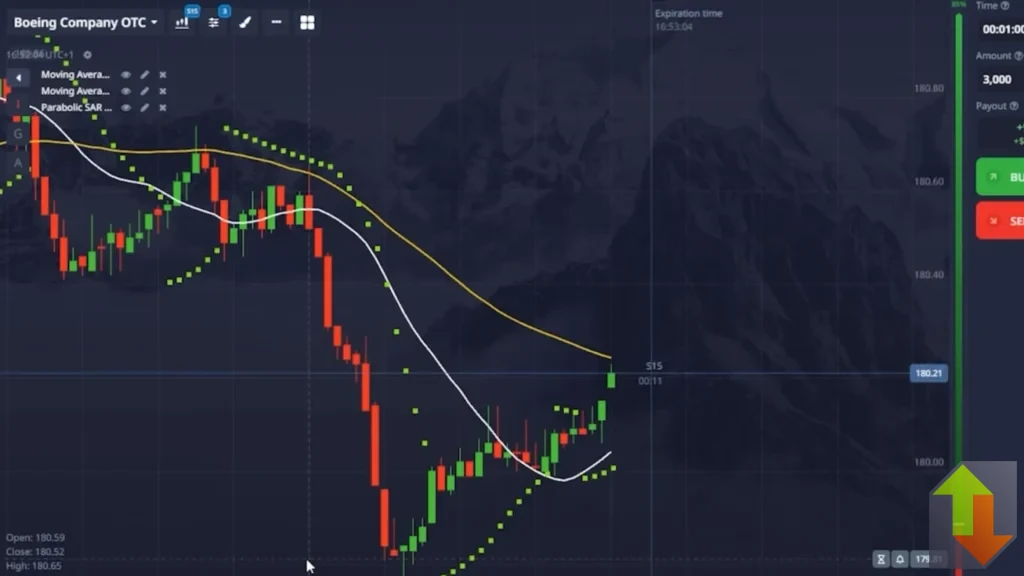
Example 2: Bullish Setup
During a clear uptrend, the 21 MA stayed above the 50 MA. As the parabolic SAR dots flipped below the candles, I placed a call (BUY) option. (See the trade in action.)
The trade finished as a win within one minute.
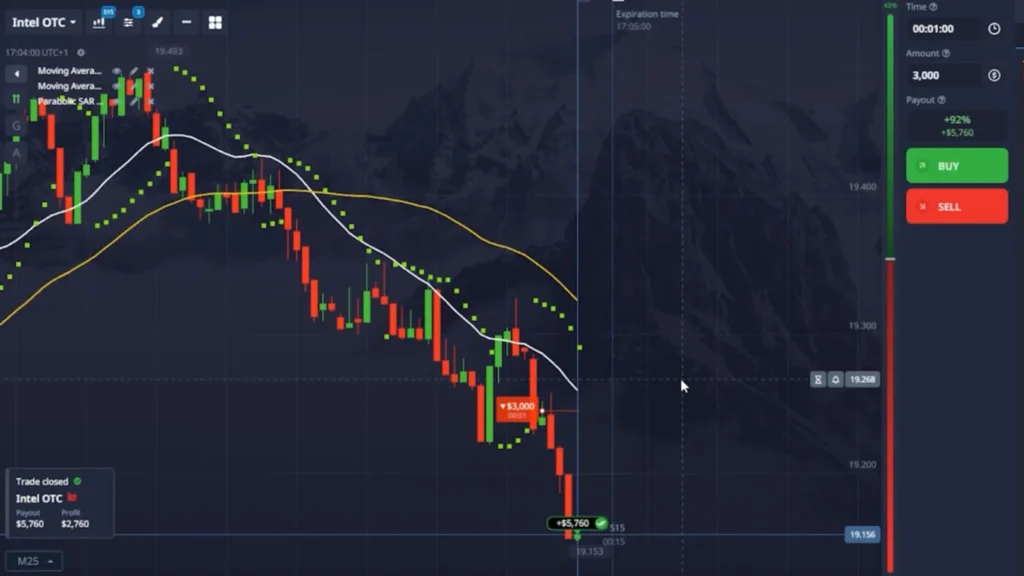
Example 3: Strong Confirmation
In another scenario, a massive bearish candle broke through support while SAR flipped above the candles. Combined with moving averages confirming the downtrend, this setup was very strong — and the trade won. (See the trade in action.)
Market Analysis
Example 1: Sideways Market – Avoiding False Signals
When moving averages flatten and price wobbles sideways, SAR dots flip frequently, creating many false signals.
In this case, I avoided trading altogether — an equally important skill as entering.

Example 2: False Signal Rejected at Support
Sometimes even valid setups fail. In this example, the moving averages pointed down and SAR flipped bearish, but price found support and reversed upward. The signal was skipped.
This shows that no strategy is perfect, and context matters.
Best Practices When Using This Strategy
The moving average and parabolic SAR binary options strategy works best under certain conditions:
- ✅ Choose instruments with high payout rates.
- ✅ Trade during active market hours (London/New York overlap).
- ✅ Avoid low-volatility sideways periods.
- ✅ Always confirm trend direction with MAs.
Risk Management
⚠️ Important Note: In the video demonstrations I risk the entire account balance per trade. This is purely for showcase purposes, to make the examples easy to follow. In real trading, you should never risk more than 1–2% of your account per trade.
Use stop-loss logic, track your results, and only scale up after consistent wins.
Practicing on a Demo Account
Before risking real money, it’s essential to try the moving average and parabolic SAR binary options strategy on a demo account. PocketOption offers a fully functional demo mode where you can test strategies with virtual funds.
This lets you build skill and confidence without pressure.
Common Mistakes to Avoid
- Trading against the moving average trend.
- Entering during sideways markets.
- Ignoring support and resistance levels.
- Overtrading after wins or losses.
- Risking too much capital.
FAQ
Final Thoughts
The moving average and parabolic SAR binary options strategy is a simple yet effective method for short-term binary options trading. It combines the reliability of trend identification with the precision of timing entries.
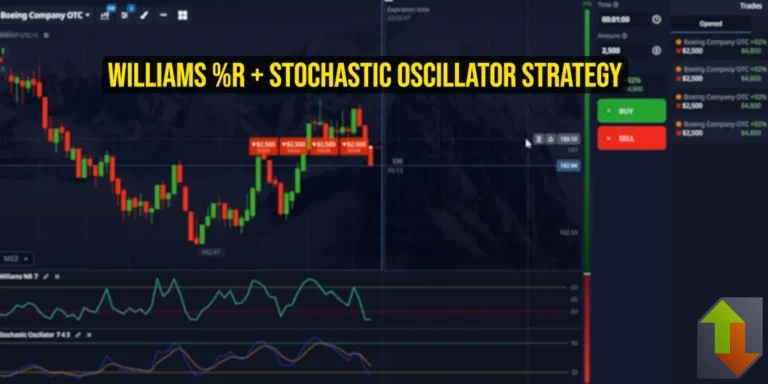
Another oscillator-based method worth testing is the Williams R and Stochastic binary options strategy, which provides momentum-based signals.
If you want to try it, begin with a demo account to practice risk-free. Once you’re confident, transition to real trades with strict risk management.
➡️ Sign up with PocketOption and test the moving average and parabolic SAR binary options strategy today.
👉 Don’t forget to subscribe to my YouTube channel for more tested binary options strategies with real trade examples.